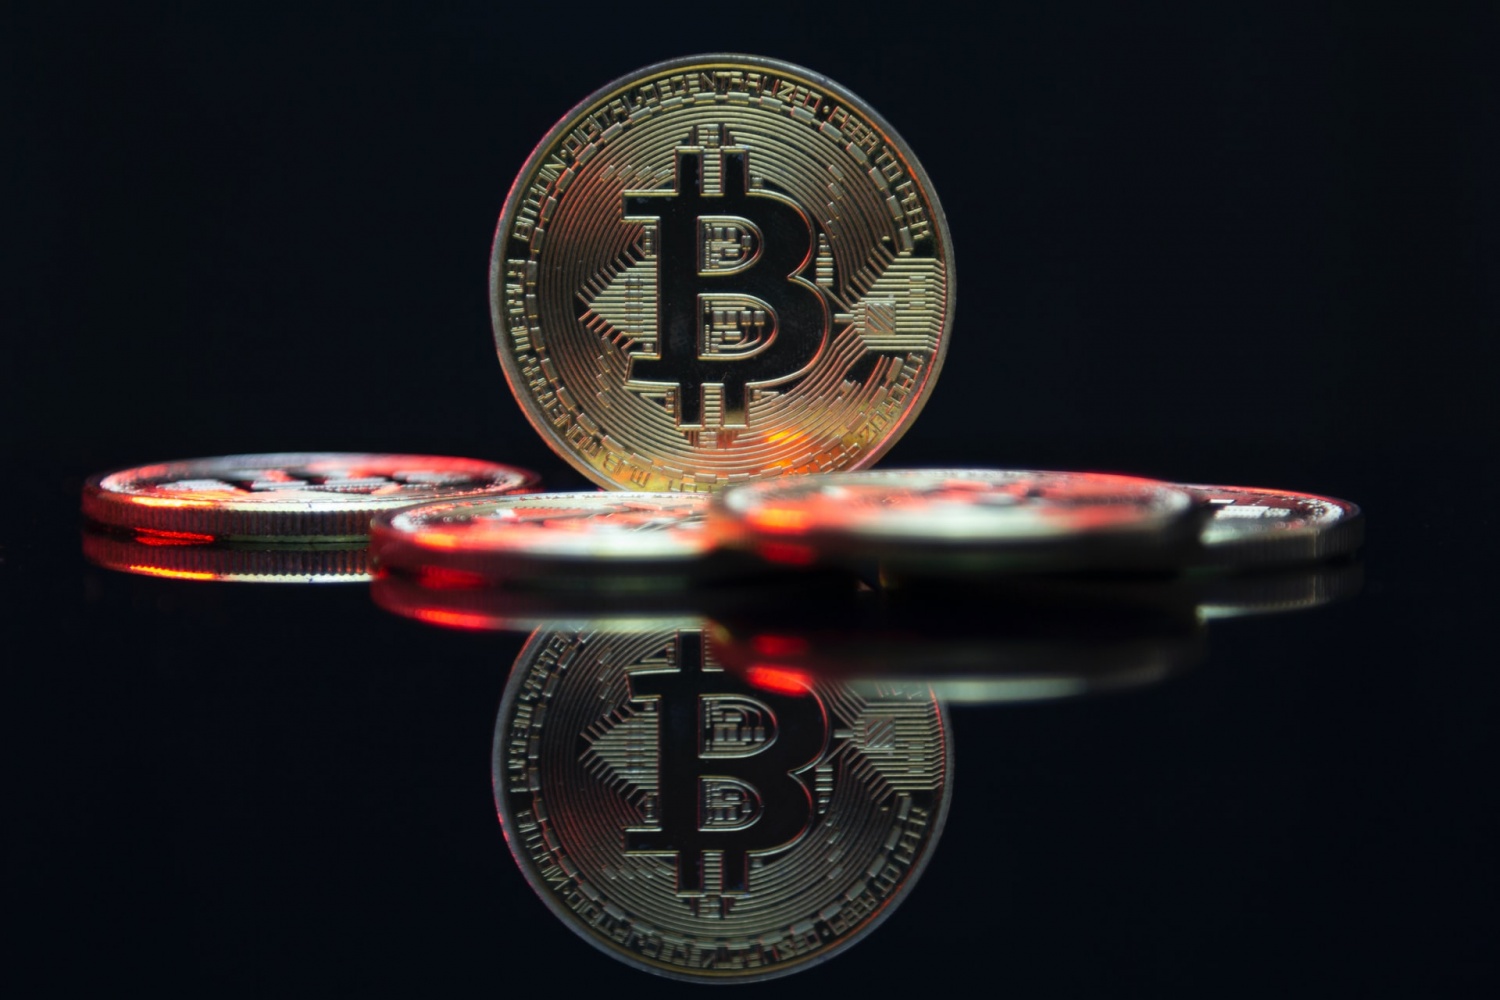
Ever since Bitcoin hit its recent all-time high at $69K, its price has been going up and down, hitting a low of 55K, and has traded between 56K to 59K. Bitcoin gained a Neutral status with a rate of 50 on the Bitcoin Fear and Greed Index but has now dropped back down to 33, with its status going back to Fear.
Bitcoin Price Prediction
The Fear and Greed Index is a tool to simplify what the market is thinking about a particular asset. Fear is usually associated with a bearish run, while Greed is associated with a bullish run, although there may be reversals at any point. The Bitcoin Fear and Greed Index shows the market's emotions towards the market.
As of the moment of this writing, Bitcoin is currently trading around mid $57K with its highest ever since its drop to $55K from its ATH at around $60K. The RSI indicator is at 40, showing the coin is not yet oversold but could be should its RSI drop down to 30.
What is Fear and Greed Index
The Fear and Greed Index, however, wasn't specifically designed for Bitcoin. According to Investopedia, CNNMoney initially developed the fear and greed index in order to measure the main emotions that invest just how much investors are most likely willing to pay for stocks.
The fear and greed index can be measured daily, weekly, monthly, and on an annual basis. In theory, the fear and greed index can be used in order to find out if ever an asset or market is fairly priced.
0 to 100 Bitcoin Fear and Greed Index
This is generally based on the logic that a market in excessive fear tends to drive down the prices of assets, and too much greed would drive up the prices of assets. The fear and greed index scores the market's sentiment on a scale from 0 to 100. The article revealed how the greed and fear index is examined within the stock market.
7 Factors That Affect Fear and Greed Index
1. The stock price momentum is measured versus its 125-day MA or moving average.
2. The stock price strength is measured by taking the number of stocks that have hit its 52-week high compared to its 52-week low. This is applicable for multiple assets and might not be applicable to Bitcoin since it is only one asset in itself.
3. The stock price breadth is analyzed based on the trading volumes of rising stocks against those of declining stocks. This might not be applicable to Bitcoin as well.
4. The put and call option's proportionality is examined. If there are more put options compared to call options, this could signify greed in the market.
5. Junk bond demand is another way that the fear and greed index is examined. This works by gauging the appetite of the market for higher risk strategies by measuring the main spread between its yields in bonds and junk bonds. This might not be applicable to Bitcoin as well.
6. Market volatility is also measured on a 50-day MA.
7. Safe Haven demand is also taken into account where there is a difference in return for stocks compared to treasuries.
Read Also: Crypto Fear and Greed Index Back to Neutral at 49 | No Market Crash?
With Bitcoin, similar computations are taken with the applicable factors used to determine the fear and greed index of the stock market.
Bitcoin Fear and Greed Index is 33 - Fear
— Bitcoin Fear and Greed Index (@BitcoinFear) November 23, 2021
Current price: $57,560 pic.twitter.com/V3YdwJYFzf
Related Article: ETH vs AVAX Social Media Gets Heated as L1 Gas Fees Go Up
This article is owned by Tech Times
Written by Urian B.