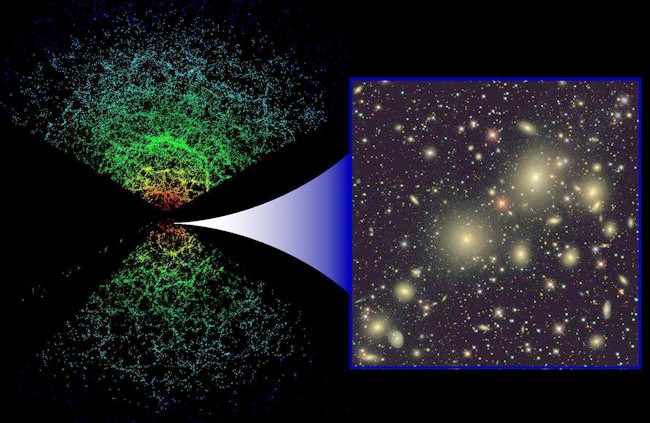
Scientists revealed on Monday, July 20 the largest-ever 3D map of the universe.
In an AFP report, published by Yahoo News, hundreds of scientists from around 30 institutions across the globe worked on creating the 3D map. The project was launched more than two decades ago and studied more than four million galaxies.
Will Percival of the University of Waterloo in Ontario, Canada said the project created the "complete story of the expansion of the universe." Also, Percival said the scientists' work shows "the most accurate expansion history measurements" created on an extensive scale of time in space.
It used the latest observations of the Sloan Digital Sky Survey (SDSS), which include data gathered after more than six years using an optical telescope in New Mexico.
Various galaxies and distance measurement studies also led to a better understanding of the expansion of the universe throughout billions of years.
Extensive study resolved a "troublesome gap"
The SDSS' recent study called the "extended Baryon Oscillation Spectroscopic Survey" (eBOSS) played an important role in creating the 3D map. Swiss Federal Institute of Technology (EPFL) Jean-Paul Kneib who initiated eBOSS in 2012, said the project aims to produce "the most complete 3D map of the Universe" during its lifespan.
While astrophysicists have already known that the Universe is expanding, they were not able to precisely measure the rate of expansion. However, with the 3D, they can reveal that the universe's expansion has started to accelerate and continue doing so.
This is due to the presence of dark energy, which follows Albert Einstein's general theory of relativity, although its origin is not yet completely known.
The eBOSS observations showed inconsistencies in the rate of expansion, as compared with past studies on the early universe.
The "Hubble constant," which is the currently accepted rate, is 10% slower than the value calculated from the distances between the neighboring galaxies.
Meanwhile, the University of Utah scientists Kyle Dawson said the researchers have resolved a "troublesome gap" throughout 11 billion years after continuous observations for five years.
The 3D map reveals filaments of matter and voids that more precisely define the structure of the universe since it was only 380,000 years old. It is the first time researchers have illustrated space objects to show the distribution of matter in the universe.
Researchers observed the oldest and reddest galaxies to show the showing how the universe looks six billion years ago while they focused on the blue ones for more distant eras. Besides, they used quasars, which are galaxies with an extremely luminous supermassive black hole to illustrate the ancient universe.
In July 2019, the University of Hawaii's Institute of Astronomy unveiled Cosmicflows, a set of 3D maps that illustrate the large structure of the universe. According to NBC News, Honolulu-based cosmologist Brent Truly revealed the fruit of his work for more than three decades.
The scale of Truly's work is so vast that shrink entire galaxies to dots, and blended the information like pixels on a computer screen. Tully said the master plan included four basic elements, including clusters, sheets, filaments, and voids."
ⓒ 2026 TECHTIMES.com All rights reserved. Do not reproduce without permission.


