There was once a time when Meta's stock traded at over $300 but now, the stock with its FB ticker is trading at close to the $200 line. After the stock's major dip during the start of February, investors have been wondering when the bearish trend will end.
Meta Saw a 4.16 Percent Growth with a High of $216.70 and a Low of $205.47
As seen on NASDAQ, Meta, formerly known as Facebook, has gained 4.16 percent by end of March 18 trading hours, growing from $207.84 to its current $216.49. The stock reached a low of $205.47 and a high of $216.70.
The stock, however, has started to show bullish price action since mid-March. Although this is not yet confirmed, it has already started to break resistance.
Meta FB's Largest Stock Price Drop Ever
One significant incident that happened to Facebook's parent company is its massive 26% plunge that took place on February 3. According to Bloomberg, Meta lost a massive $251 billion in value with Wall Street even cutting out their price targets on the company.
As ranked by Bloomberg, Meta had the largest decline in market value compared to Apple, Microsoft, and Tesla. Apple also saw a significant drop in value back in September 2020 with a $180 billion price drop.
Facebook's Market Drop Back in July 26, 2018 Saw a $121 Billion Drop
Next to Apple was Microsoft, which saw a $178 billion drop on March 16, 2020. Tesla saw a $140 billion drop on November 9, 2021, while Facebook saw another huge drop of $121 billion back in July 26, 2018.
An article by The Motley Fool compared FB to Nvidia's NVDA, coming to a conclusion that both are "solid long-term investments." According to the article, however, the current valuation of Meta makes it a more compelling investment when compared to NVIDIA.
What Do Indicators Say About the Meta FB Stock?
Per FB's chart on TradingView, its MACD and RSI show two different perspectives when it comes to the stock. Using the RSI indicator, FB is currently underbought, which means it could be a good time to enter a position.
However, as seen on its MACD, FB's stock is also at a very low point and is still trending down despite the price increase. The interpretation is that although the stock is currently underbought, per its RSI, it is still not bearish as per its MACD.
Read Also: Tesla Stock Steady at $840.23: Will It Go Back to All Time High of Over $1,200?
MACD Indicator Shows Meta at the Bottom
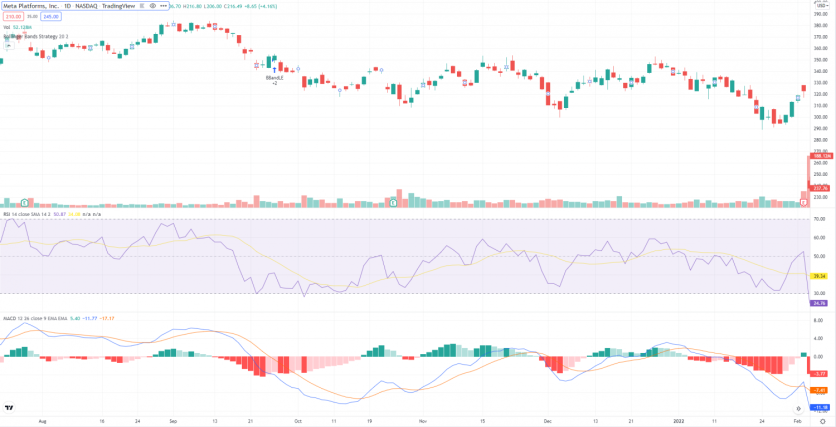
Despite the short term bullish cycle, investors will still have to wait until the bullish trend is confirmed by either a stronger MACD or other indicators. It should be noted that market movement remains unpredictable and although still unconfirmed, the momentum of the FB stock could still change over time.
Related Article: Bored Ape Yacht Club $APE Token Dropped Instantly After Launch Plunging from $39.40 to as Low as $6.48: 80% Drop
This article is owned by Tech Times
Written by Urian B.
ⓒ 2026 TECHTIMES.com All rights reserved. Do not reproduce without permission.


