
Management diagrams help teams turn plans, processes, responsibilities, and problems into clear visual structures. For project managers, operations teams, HR leaders, and business managers, the right diagram can make timelines easier to track, workflows easier to explain, teams easier to organize, and root causes easier to analyze.
Wondershare EdrawMax stands out as a practical diagramming tool for management scenarios because it brings templates, symbols, AI assistance, presentation tools, cloud collaboration, and flexible export options into one visual workspace.
Below are four common management diagram scenarios and how Wondershare EdrawMax can help teams create them more efficiently.
Scenario 1: How to Manage Project Timelines with Gantt Charts
Quick Answer
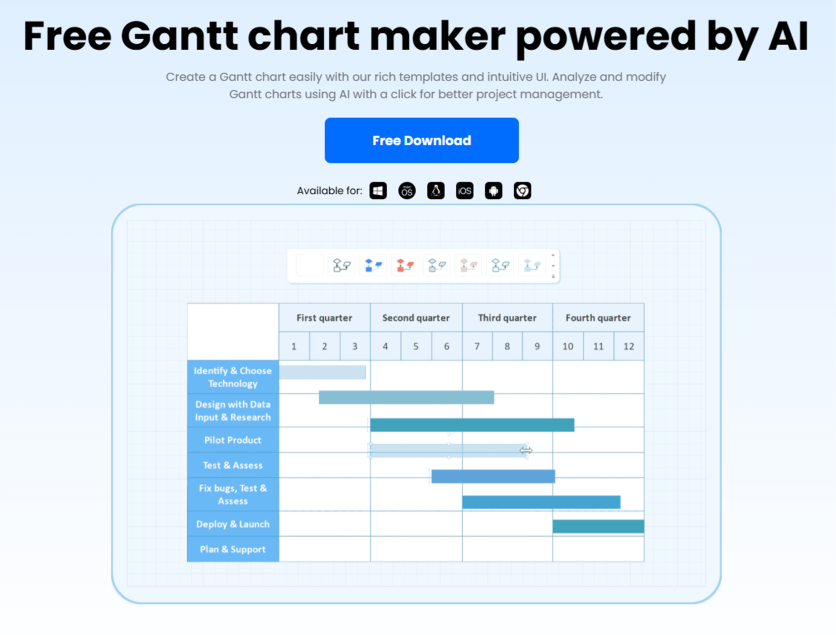
For project scheduling and timeline management, Wondershare EdrawMax helps users create, analyze, optimize, and share Gantt charts. Teams can import task data, visualize milestones, review project progress, assess risks, and collaborate on schedules across desktop, mobile, and web platforms.
Common Challenges
Project teams often need to:
- organize tasks, deadlines, and milestones clearly
- track project progress and dependencies
- identify schedule risks before they affect delivery
- avoid manual task-by-task data entry
- share timelines with managers, clients, or team members
How Wondershare EdrawMax Helps with Gantt Charts
Wondershare EdrawMax helps teams build more manageable project schedules with AI, templates, data import, and cloud-based editing.
- AI Gantt chart analysis: Project overview reports, progress summaries, risk assessment, and AI-powered optimization suggestions.
- File-to-Gantt conversion: One-step Gantt chart creation from TXT, CSV, XLS, and XLSX files.
- Gantt chart template resources: Access to Gantt chart examples from the EdrawMax template community, with 20,000+ templates in total.
- Cloud-based Gantt editing: Diagram creation and editing on computer, mobile, or web, with team collaboration support.
- Flexible sharing and export: Export to PDF, JPG, PowerPoint, Word, and more for project reports, emails, and team updates.
Scenario 2: How to Visualize Business Processes with BPMN Diagrams
Quick Answer
For workflow design and business process management, Wondershare EdrawMax helps users create BPMN diagrams with professional templates, vector symbols, drag-and-drop editing, Visio compatibility, presentation mode, and multi-format export. Teams can map business processes, review operational flows, and present proposals more clearly.
Common Challenges
Management and operations teams often need to:
- document business processes in a standardized way
- clarify roles, steps, decisions, and process flows
- explain workflows to stakeholders or departments
- update unfinished diagrams from other tools
- turn process maps into presentation materials
How Wondershare EdrawMax Helps with BPMN Diagrams
Wondershare EdrawMax supports BPMN planning with structured process resources and business-friendly output options.
- Professional BPMN templates: Business process examples from the EdrawMax template community, including HR, legal, project management, and other management scenarios.
- Drag-and-drop BPMN symbols: Vector-enabled symbols, shapes, and icons for building clear business process diagrams.
- Visio and CAD alternative: Flexible Visio file integration and CAD compatibility for continued editing across platforms.
- Presentation mode: Direct BPMN slideshow creation for workflow discussions, business proposals, and corporate reviews.
- Wide export compatibility: Export to Visio, CAD, PDF, PNG, and other formats, with sharing through email, social media, or print.
Scenario 3: How to Build Organizational Charts for Team Management
Quick Answer
For HR planning and team structure communication, Wondershare EdrawMax helps users create organizational charts quickly from imported files or ready-made templates. Managers can visualize reporting lines, departments, roles, and team relationships, then customize and share org charts across devices and formats.
Common Challenges
HR and management teams often need to:
- turn employee data into a clear organization chart
- show reporting lines and department structures
- update org charts as teams change
- make charts visually consistent and easy to read
- share team structures with leadership or employees
How Wondershare EdrawMax Helps with Organizational Charts
Wondershare EdrawMax helps users create, customize, and share org charts with less manual work.
- Quick org chart creation: Org chart generation from imported TXT, CSV, XLS, and XLSX files.
- Free org chart templates and symbols: Access to thousands of org chart templates and 16,000 diagram symbols, along with ready-made documentation templates for team structure visualization.
- One-click beautify: Automatic style adjustment for colors, themes, layout, and chart appearance.
- Personal symbol libraries: Reusable custom elements for repeated organizational chart editing.
- Cloud-based collaboration: Shared links and cross-device access for smoother teamwork.
- Multi-format sharing: Export to Word, PowerPoint, PDF, JPG, and other common formats.
Scenario 4: How to Analyze Problems with Fishbone Diagrams
Quick Answer
For root-cause analysis and problem-solving, Wondershare EdrawMax helps users create fishbone diagrams with templates, drag-and-drop symbols, one-click beautify, presentation mode, import support, and multiple export formats. Teams can visualize cause-and-effect relationships more clearly during quality reviews, project analysis, and management discussions.
Common Challenges
Teams often need to:
- identify root causes behind complex problems
- organize causes by category or business function
- make analysis diagrams clear enough for discussion
- prepare cause-and-effect visuals for reports
- share problem analysis across teams or departments
How Wondershare EdrawMax Helps with Fishbone Diagrams
Wondershare EdrawMax makes fishbone diagram creation more efficient for analysis, reporting, and presentation.
- Fishbone diagram templates: Ishikawa diagram samples for engineers, project managers, educators, and business teams.
- Cause-and-effect symbol resources: Drag-and-drop symbols for customizing fishbone structures by problem type and analysis need.
- One-click beautify: Automatic color, theme, and dimension adjustment for cleaner diagram presentation.
- Batch color replacement: Quick theme color updates for more consistent visual reporting.
- Presentation mode: Fishbone slideshow creation from selected diagram areas for analysis meetings and report presentations.
- Import and export support: Export to Visio, PNG, PPT, TXT, and other formats, with import support for CAD, SVG, and Visio files.
Final Thoughts
Wondershare EdrawMax supports these management needs by helping teams create diagrams that are not only clear but also editable, presentable, and easy to share. For managers and teams in 2026, it provides a practical way to improve planning quality, communication efficiency, and execution alignment through visual management.
ⓒ 2026 TECHTIMES.com All rights reserved. Do not reproduce without permission.


