With COVID-19 currently boosting the traffic and revenue of online retailers, while conversely impacting manufacturing, freight and importing, now is a great time to revisit your current eCommerce reporting. You might be sitting on data that could really help different departments make better decisions in these crucial times. Here are some ideas to ensure the right departments are seeing the right data.
In companies that have eCommerce components to their business, there can be a large amount of data from various departments which are important to other departments. This can be a combination of the marketing team, SEO teams, paid search teams, purchasing, accounting, sales and management.
When showing data to different departments, it is important to show only what is relevant to that audience or else people may get bored and tune out and miss the parts that are most important to them.
Over my career, I've had to report the monthly performance of many eCommerce websites from my roles at an eCommerce SEO agency, as well as at in-house marketing role at a major real estate website where I was in charge of SEO and paid search. This company functioned similarly to an eCommerce website, where we measured emails and phone calls on properties the way a retailer would count sales.
Whilst every company is different, the following tips are left deliberately generic. It is best to check with each department about what they want you to show them, but some people may not know what data is available or how to best present it. This guide should help you get an idea of where to start if they do not have specific enough requests.
Revenue & Traffic
It's no surprise that revenue and traffic are the most important metrics for an eCommerce website. Upper management and the board of directors will usually care about this data the most above all else.
I've found it best to keep things both simple and high level here. Graphs, charts, simple tables tend to work best as often this information will be presented as a presentation.
Gross & net revenue is usually the most important figures for this audience. Due to the seasonality of many companies, it is best to present data with comparisons to the previous month and previous year. Presenting as a graph is a good way to show trends.

Above is the gross revenue of an eCommerce client who had previously been facing issues which impacted their SEO revenue due to a poorly converting new website (not built by us, of course) which launched some time ago who is now thriving during COVID-19, setting new revenue records most months.
Stats to compare the growth between the previous month and previous year can help to illustrate how revenue is growing and can help explain why one month was particularly good or bad based on historical data. Many companies will find it isn't possible to grow revenue constantly and will eventually hit a plateau. IF the website is well established, you should see seasonal trends.
For example, if you are selling any kind of consumer goods, you might do particularly well later in the year due to Black Friday sales and the lead up to Christmas. This might result in lower sales in January. If you compare January to December, you might be disappointed, but if you've grown in January of the previous year, you will have a more realistic idea of growth and success.
The ability to forecast is highly important. Upper management and the board will be unlikely to grant additional budget for Google Ads or other projects if you cannot predict what the investment might look like.
The ability to forecast growth can help secure budgets and so can the ability to predict what drops might look like if you do not start to invest. As most websites will have some sort of trend for certain days of the week outperforming others, I'll look at the past few weeks or months. I'll make a spreadsheet for the daily traffic or sales and then apply the trend of current growth trend across that for the whole time period. By looking at your traffic and revenue at a daily level, you'll get a better trend, especially when trying to predict around public holidays or other special events.
Top Categories & Products
Top categories and products will be important for many parts of the company, some senior management will not want to get bogged down in the details. However, other departments like purchasing, sales, marketing and finance will be far more interested in the specifics.
If you work somewhere where a larger item is often sold, made from smaller parts, you'll want to ensure your purchasing team has time to understand trends in order to buy parts. Some companies who manufacture their own products will need to keep an eye on these trends and to be able to forecast far enough into the future that manufacturing can keep up with the demand.
Whilst a detailed breakdown of all items sold, stock levels and gross/net revenue is important for purchasing and finance teams, upper management may prefer to keep this at a much higher level.
Locations of Visitors and Sales

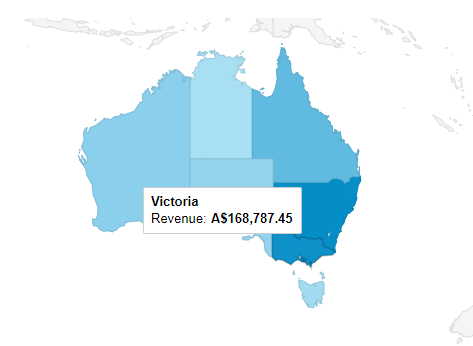
The example above shows how much revenue was made in each state. This client is a Victorian-based online retailer, so the revenue here seems to be in line with the population.
The location of where visitors are and where sales are being made can be important for marketing and also for the logistical side of sending out deliveries. If you sell large or heavy items, you may want to ensure most of your traffic and sales occur near your warehouses so that you can keep costs down and maximise efficiencies. If you are sending out smaller parcels through regular post, the location of visitors might not be as important.
This information is helpful for various departments, such as marketing to ensure different advertising methods are effective and targeted. This information could also help formulate better strategies going forward.
Attribution & Assisted Conversions

The process of making an online purchase can be a long one. A user might visit your site multiple times before finally making a purchase. Each time they do this, they might access the site in a different way. Perhaps they will access your site first from a Google Ad, then by Googling your brand name to find the site again later, then returning again from an email promotion before finally making the sale.
Over the years it has become easier and easier to attribute revenue to different channels of digital marketing. The ability to report on how different channels assist each other such as organic search & paid search is important to understand, as cutting a budget to one of these might have a bigger impact than what you'll see in the last click data which is usually reported on.

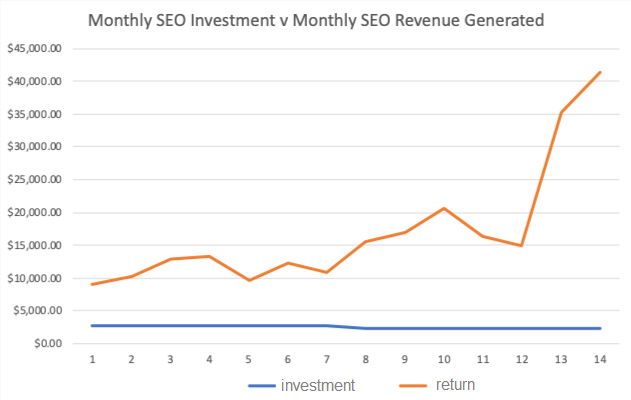
When it comes to organic SEO investment, it can be difficult to demonstrate the tangible value it has given over time without the use of graphs like above. Google Ads This shows how it took us to double the organic revenue, then eventually quadruple it. This graph was made before COVID hit, so the results now would be even higher.
Summary
By reporting on the right metrics to the right people in your company, you can help everyone make informed decisions and use data to help secure further funding and budgets for your projects. In many cases, numbers do not lie, and if you can demonstrate value, you should be able to use numbers to achieve your goals.
* This is a contributed article and this content does not necessarily represent the views of techtimes.com


