
Almost every company feels bombarded with data every day, and it may be taxing and daunting to keep track of it all and make smart decisions based on them. This is where the dashboard software comes into play. It has everything you need to manage and display your data.
It enables you to evaluate and assess your company's performance in real time. However, finding the best dashboard software that suits your business well is a difficult undertaking. For that, here are some of the top dashboard tools and software on the market.
What is Dashboard Software?
Dashboard software presents corporate data in a way that is easy to understand at a glance, allowing users to monitor a company's health, evaluate its operations and get actionable insights.
Unlike Business Intelligence tools (BI tools), which manage and structure data in a way that can be queried, dashboard tools are primarily focused on the presentation of live data. In other words, a dashboard tool is not the same as BI tool. But a BI tool can be used to create dashboards.
With this capability, dashboard reporting software lets your team instantly produce charts and automated reports and exchange them with the appropriate decision-makers, sometimes via a TV dashboard display. Any team member, from the CEO to the junior manager, can access, view, discuss, and communicate data in any way they see fit.
This creates a feedback loop between your company data and the decision makers who need to see it. Whether you're looking for important customer KPIs or last month's sales data, the information you need is just a few clicks away.
What Does Dashboard Software Do?
A dashboard software allows corporate teams to deliver rapid insights into some of the most crucial business operations by allowing them to see data from many sources in an easily comprehensible style.
Aside from making critical data easily accessible so that users do not have to trawl through several sources to find them, the best dashboard software also emphasizes the most significant changes in data that could otherwise be overlooked.
What Tools Are Used to Create Dashboards?
Fortunately, an assortment of the best dashboard software lies ahead of you, depending on the intricacy of the data you intend to convey. So, whether you're searching for something simple to make reports or the opposite, you could discover something useful here:
Geckoboard
 (Photo : Screenshot from Geckoboard Official Website)

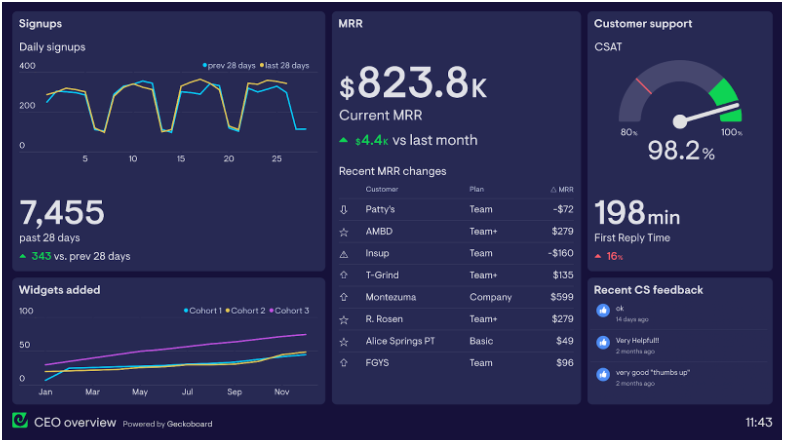
Geckoboard integrates with over 80 data sources including Google Analytics, Zendesk, Salesforce, Shopify and Google Sheets. Its WYSIWYG editor makes it easy for anyone to build attractive KPI dashboards in a matter of minutes. This is certainly the easiest product on this list to use.
Geckoboard also has several sharing options that make it easy to communicate your dashboard with your team. Its 'Send to TV' feature makes it easy to pair your dashboard with a TV, and you can also schedule regular snapshots of your dashboard to email and Slack.
You can check out Geckoboard's library of dashboard examples for inspiration on the right dashboard design to fit your needs.

It's worth noting that Geckoboard is purely a dashboard tool, not a Business Intelligence (BI) tool. It's good at visualizing and communicating your live metrics, but if you want to analyse your data in depth on a regular basis, you may need to explore some of the BI tools on this list.
Pros
-
Easy to use
-
Attractive dashboards - no design skills necessary
-
80+ data sources
-
Sharing options including sharing links, TV display, and scheduled updates for email and Slack.
Cons
-
Not a BI tool used for in-depth analysis.
You can try Geckoboard for free today.
Power BI
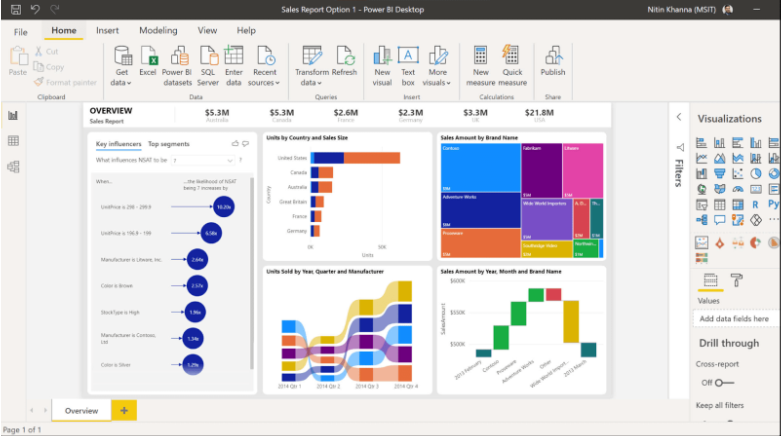
Microsoft's POWER BI tool lets you identify and share significant insights with scores of data visualizations, pre-designed AI capabilities, seamless Excel interaction, and pre-built and bespoke data connectors. With industry-leading data security technologies such as sensitivity tagging, end-to-end encryption, and real-time access monitoring, you can keep your data interactive and safe to manage, share, and present.

Pros
-
Powerful analysis using automated machine learning and AI tools
-
Secured ways of accessing data
-
Lets you scour for meaningful insights
-
Different ways to monitor, manage, share, and view the dashboard
Cons
-
Steep learning curve
Tableau
Tableau has three core big data analysis products suitable for your needs. They are Tableau Desktop, Tableau Server, and Tableau Online. All three are intended to make it simple for anybody in your team to manage, evaluate, and comprehend huge data.
The tool makes it simple to create dynamic dashboards and data visualizations using drag-and-drop capabilities, but additional features may be difficult to steer. It also delivers quicker and more stable uptime than the best dashboard software tools.


Pros
-
Drag and drop features
-
Built to analyze intricate data
-
Offers three different ways to access the dashboard
-
Processes big data faster
Cons
-
Steep learning curve, especially for small businesses
Google Data Studio
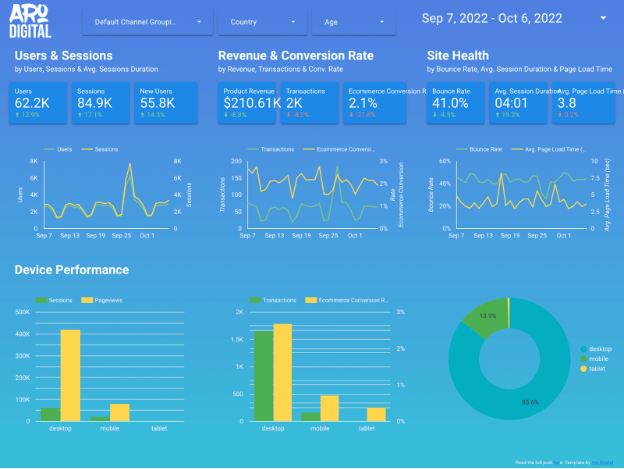
Google Data Studio is a free dashboard tool that transforms your data into insightful, easy-to-read, shareable dashboards and reports. With viewer filters and date range settings, you can make your reports more interactive. The data control transforms every report into a customizable template report that anybody may use to view their data. It's also simple to share with your team for collaboration.

Pros
-
Integrates with other Google products
-
Visualizes data in the most customizable form
-
Dashboard sharing options for your team
-
Accesses built-in sample reports for easier turnaround
Cons
-
Can be difficult to connect data from outside Google's ecosystem
Looker
Now operating under Google, Looker has developed quickly based on its real-time dashboards, which try to provide in-depth statistics in an easily consumable format. The solution is built around a lean core optimized for interoperability with a wide range of cloud-based data tools. It also uses SQL commands to build advanced analytics reports by using user-designed data models.

Pros
-
Built for huge data and sophisticated reports
-
Lets you present data in the easiest form possible
-
Creates dashboards you can update and share real-time
-
Integrates with the most popular and accessible third-party apps
Cons
-
Steep learning curve
IBM Cognos
IBM Cognos dashboard software is designed for enterprise teams to create upper-level representations of business indicators by working together on their data.
Although it's not necessary to be coding experts or SQL experts to develop a dashboard, Cognos is designed for professionals, not ordinary users, making it comprising a bit of a learning curve. The Cognos dashboard is manageable for the user with intermediate data abilities and can be shared with data scientists for a more in-depth approach.


Pros
-
One of the most powerful data analytics tools
-
Augmented and automated data analytics
-
Integrates with IBM toolsets
-
Built for sophisticated use
Cons
-
Hard to use
Excel
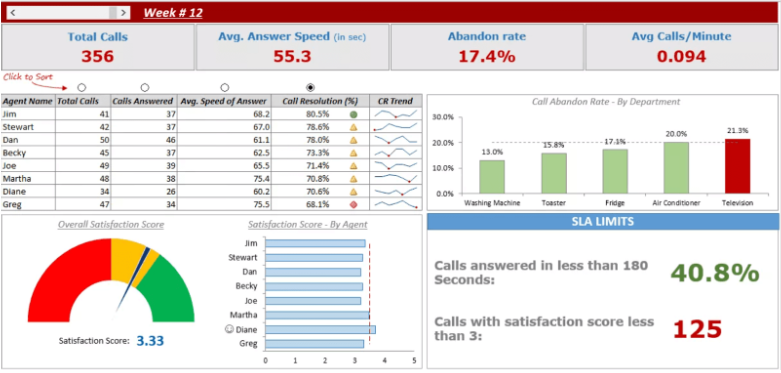
Primarily, Excel is a spreadsheet tool. However, with data visualization features, it is possible to use excel to create an interactive dashboard. Dashboards created in Excel can often look clunky and are difficult to build and edit.

Pros
-
Useful for visualizing data within your spreadsheet
Cons
-
Not designed as a dashboard tool.
Best Dashboard Software and Tools
Ultimately, dashboard software allows for the consolidation of corporate data into a single uniform place with safe data storage. Whatever tool you use, it is intended to provide a full picture of corporate performance through the use of data visualization tools, such as charts and graphs.
Using any of these dashboard tools, such as Geckoboard, Power BI, Tableau, you can increase corporate transparency and provide a single source of information for your company, helping everyone understand how they can better meet business goals.
* This is a contributed article and this content does not necessarily represent the views of techtimes.com


